


Creating Online Dashboards & Story Maps using arcGIS Online
Salepage : Creating Online Dashboards & Story Maps using arcGIS Online
Archive : Creating Online Dashboards & Story Maps using arcGIS Online Digital Download
Delivery : Digital Download Immediately
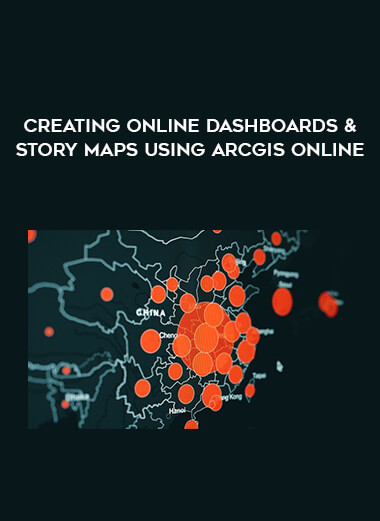
This is a step-by-step online dashboard creation course that will teach students how to take geographic data and visualize it using the fantastic program ArcGIS online. The course is divided into three sections:
The first portion of the course explains about the technique of creating account in ESRI ArcGIS online, then how to sign into to the account. All buttons and menus of the website will be taught thoroughly to the students and after that it will explain how to utilize the existing layers inside the Living Atlas Server and how to import them and alter them in ArcGIS online. It will demonstrate how to import the Covid-19 layers from that server and access them from the Dashboard. Then, the process of designing a comprehensive dashboard – generating line charts, bar charts, pie charts, indicator, gauges, head bar and side bars – are all discussed one by one.
The second portion, it will be discussed how to upload our own geographical data with csv format to ArcGIS online server and then how to plot the data on a map. Then it will explain how to import that map into the Dashboard. In this phase the second dashboard with improved speed and functionality like filtering the data by date is constructed.
The third segment of this course examines ArcGIS narrative maps, and all relevant choices and buttons are discussed approximately, with a sample story map generated at the end of the course.
More from Categories : Everything Else


Reviews
There are no reviews yet.